Futura
Solar
Integrated Solar Roofing
System
2395 Speakman Drive, Mississagua, Ontario, Canada L5K 1B3 • Tel: (905) 822-4111 • Fax: (905) 823-1446
Energy Performance Testing of Prototype Air-Heating
Solar Energy Systems
A Report to: |
Futura Solar, LLC
3536 University Blvd. North
Jacksonville, FL 32277
USA |
Attention: |
Mr. Patrick O’Leary
Tel.: (917) 945-8480
Fax: (904) 745-0090
|
Report No.: |
03-08-0506
11 Pages plus 2 Appendices
|
Date: |
October 31, 2003 |
1 |
|
INTRODUCTION
Futura Solar, LLC (the Client) has developed two prototype solar energy systems. Testing was
performed by Bodycote Materials Testing Canada (BMTC) to evaluate the transient air
temperature distribution within the system enclosures and to measure their overall energy
performance. |
|
2 |
|
SAMPLE DESCRIPTION
Two prototype solar energy systems to be tested were supplied by the Client. The system has a
common base (box), with two interchangeable roof designs designated ‘Sawtooth Roof’ and
‘Sloped Roof’. The base is 56 in. wide by 48 in. deep by about 60 in. high, with a solar collector
forming the ‘roof’ section, a window on the rear vertical surface, an air intake louver below the
window, and a horizontal outlet header located at the top of the solar collector. The roofintegrated
air-heating solar collector on the prototype systems has a small air turbine installed in
the horizontal outlet header. The air turbine was removed for all tests, because it caused an air
flow restriction when not rotating, and because the air flow under natural convection conditions
was not sufficient to turn the turbine. The theory of operation of the solar energy systems is
described in a confidential draft patent application provided to BMTC by the Client. Digital
images of the systems are included in Appendix B. Both prototypes are designed to be mounted
onto a building roof to extract air from inside the building, to heat the air extracted from the
building, and to admit daylight into the building.
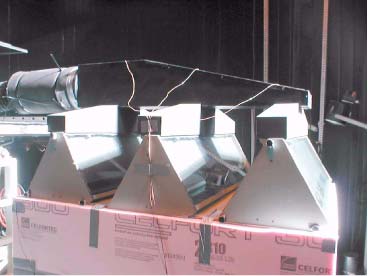
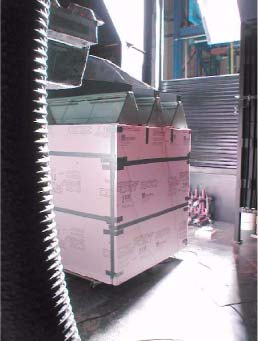
The Sawtooth Roof collector base is horizontal (i.e., designed for installation on buildings with
flat roofs), with three angled glazed sections with a black-painted wood/metal outlet header on
top that collects heated air from each section. Another feature is a wind sensing elbow at the
outlet of the collector header, which turns itself away from the wind in order to draw heated air
from the collector. It was necessary to remove this elbow for all but the “Maximum Air Flow”
test on this prototype. The collector gross area (i.e., sum of the products of length times width
for the three glazed slopes) is 12.75 ft², or 1.185 m². During testing only 0.55 % of the glazed
area was irradiated, therefore the efficiency calculations were corrected for shading.
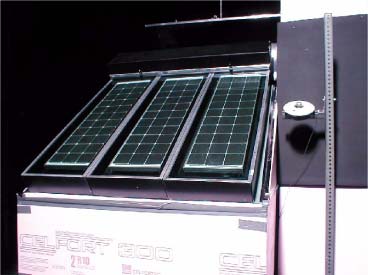
The Sloped Roof collector design incorporates a black-painted metal outlet header above (but
not shading) three separate collector sections, which have clear plastic covers and which are
side-by-side. The collector glazing is sloped 35° from horizontal, and the collector gross area
(excluding outlet header) is 20.25 ft², or 1.881 m². A Siemens model SM50-H 50 Watt
photovoltaic panel is installed under the glazing of each of the three sections. The following
information was inscribed on the nameplate of the centre PV panel (the one used for the
electrical output measurements described below).
- VOC = 19.8 V
- ISS = 3.35 A
- Vrated = 15.9 V
- Irated = 3.15 A
- S/N 019754G
|
|
3 |
|
TEST PROCEDURES
3.1 PROTOTYPE 1 - SAWTOOTH ROOF
The first prototype was subjected to the following tests as discussed with the client on August
14, 2003.
- A test to determine the maximum expected flow through the system (the “Maximum Air
Flow” test);
- A series of tests to determine the efficiency versus airflow under two ambient
temperatures and three airflow conditions;
- Daylighting tests to measure illumination in several locations within the enclosure.
Maximum Air Flow Test
The Sawtooth Roof system was fitted with seven (7) type T thermocouples in locations agreed
upon between the Client and BMTC, which included four (4) shielded thermocouples for air
temperature measurements inside the system enclosure and three (3) unshielded thermocouples
in the horizontal outlet header. The shielded air temperature thermocouples were located at the
centre of the enclosure at 16, 32, 48 and 65 inch heights from the ‘floor’. One unshielded
thermocouple was centred in the outlet header air stream of each of the three glazed collector
sections.
The system was sealed with foil tape and RTV sealant to minimize air leakage, then the walls
and base were insulated on the outer side with 2 inch thick rigid foam. The system was then
positioned in the solar simulator chamber at an ambient air temperature of 20 °C (68 °F) and
exposed to simulated solar radiation applied at an incident angle of 40° down from horizontal.
The average irradiance level, measured at six points on the Sawtooth Roof, was 1030 W/m².
When thermal equilibrium was reached, three traverses, as per diagram D-10B on p. 64 of
ASHRAE Standard 111-1988, were made across the 8 inch diameter outlet duct using a
calibrated hot-wire air velocity meter (MII# A10835).
Thermal Efficiency Tests
The pivoting elbow at the outlet of the collector header was then removed, and Bodycote’s
conditioned airflow test apparatus was connected to the prototype system for tests of system
thermal output versus airflow rate through the system. Conditioned air at 70 °F (21 °C) was
drawn through the system using a controlled speed centrifugal fan. Mass flow was measured
using a calibrated laminar flow element (MII# B00610) and a calibrated micromanometer (MII#
A08069). Average incident solar irradiance was recorded and maintained at approximately 900
W/m² during the test. System energy output was measured at three different airflow rates at each
of two different ambient air temperatures.
Daylighting Test
In order to perform the daylighting tests, the system was moved outdoors and the base was
sealed to minimize the light entering the enclosure other than through the roof. The light levels
were then measured in fifteen locations within the enclosure using a calibrated precision
lightmeter (MII# B05851). The readings were taken near 12:30 PM on 2003-Sep-09 under clear
sky conditions, with the collector sections turned to face the sun. The light level readings were
taken in a horizontal plane 16” below the roof level. The outdoor solar irradiance on a southfacing
surface tilted 45° from horizontal was also recorded.
3.2 PROTOTYPE 2 – SLOPED ROOF
The second prototype was subjected to the following tests:
- A series of tests to determine the efficiency versus airflow under two ambient
temperatures and three airflow conditions;
- Measurements of current and voltage of the centre collector to establish an IV Curve and
the PV Array Output for each of the above test conditions;
Thermal Efficiency Tests
The system was configured to the Sloped Roof design and fitted with three (3) shielded type T
thermocouples for air temperature measurements inside the system enclosure. The shielded air
temperature thermocouples were located at the centre of the enclosure at 16” and 32” heights
from the ‘floor’, and at the opening into the centre collector section. (This opening is at the upper
edge of the collector section, so that it extracts air from the “room” at the highest point below the
roof.) An additional type T thermocouple was attached at the rear centre of the PV module. The
system was sealed with foil tape and RTV sealant to minimize air leakage, then the walls and
base were insulated with 2” rigid foam on the outer sides.
The system was then positioned in the Solar Simulator chamber and connected to Bodycote’s
conditioned airflow test apparatus for thermal efficiency testing. Insulated inlet and outlet
connections that incorporate fluid temperature sensors were attached. Simulated solar radiation
was applied at an incident angle of 40° down from horizontal. Solar irradiance was measured
with a pyranometer mounted beside the system under test. An irradiance uniformity scan in the
plane of the collector was done in order to relate the irradiance at the pyranometer position to the
average solar irradiance incident on the collector aperture, which was then maintained at
approximately 900 W/m². System energy output was measured at the same conditions used for
testing the Sawtooth Roof design.
PV Panel Electrical Output
Three PV panels were installed below the glazing of this prototype system. The electrical output
of only one PV panel—the one in the central section of the prototype—was measured. After
each of the six thermal performance measurements was completed, and while steady state
conditions were maintained with approximately 900 W/m2 solar irradiance, the electrical output
of the PV panel was measured. For each determination of PV panel electrical output, the
following data were recorded.
- Open-circuit voltage
- Near-short-circuit current
- Current output at 14.5 V (and in one case, 15.0 V)
The near-short-circuit current was measured using a current shunt, so there was a small positive
voltage across the PV panel for that measurement (as recorded in the Results section of this
report). A Kikisui electronic load (MII# A08927) was used to adjust the current draw from the
PV panel until the desired PV panel voltage was achieved during measurement of the PV current
output at near rated voltage.
|
|
4 |
|
RESULTS
4.1 PROTOTYPE 1 - SAWTOOTH ROOF
Maximum Air Flow Test
The temperatures measured during the Maximum Air Flow test are graphed in Figure 1 in
Appendix A. The graph shows that the air temperatures below the solar roof are representative
of what one might expect for a standard building with a high open ceiling. The air is relatively
mixed at the lower levels (16 inches to 48 inches from the floor), with the hot air (30 °C)
confined to the upper air layer just under the solar roof. The average airflow rate under natural convection conditions was measured to be 7.8 ± 3.9 cfm.
Based on the gross collector area of 12.75 ft², this measured natural convection airflow rate is 0.6
± 0.3 cfm/ft².
Thermal Efficiency Tests
Thermal efficiency tests were performed at airflow rates of 0.6 cfm/ft², 1 cfm/ft² and 2 cfm/ft², at
chamber ambient air temperatures of approximately 70 °F (21 °C) and 40 °F (4.5 °C). Inlet air to
the side of the prototype box was conditioned to 70 °F (21 °C) for all tests.
Collector efficiency was calculated based on the net irradiated area 7.07 ft² (=12.75 ft² × 0.555)
of the Sawtooth Roof collector, using average measured data. Test data are reported in Table 1,
and temperature measurements are included in Appendix A.
Daylighting Test
The average of fifteen light readings measured in a horizontal plane 16 inches below the roof
level was 840 lux. The roof level is defined as the horizontal plane at the bottom of the sawtooth
solar collectors. The outdoor solar irradiance on a south-facing surface tilted 45° from horizontal
was 1014 W/m² during the measurement period.
Table 1: Sawtooth Roof Thermal Performance Test Results (PDF Format)
4.2 PROTOTYPE 2 - SLOPED ROOF
Thermal efficiency tests were performed at airflow rates of 0.6 cfm/ft², 1 cfm/ft² and 2 cfm/ft², at
chamber ambient air temperatures of approximately 70 °F (21 °C) and 40 °F (4.5 °C).
Collector efficiency was calculated based on the gross area (20.25 ft²) of the Sloped Roof
collector, using average measured data. Test data are reported in Table 2 below, and temperature
measurements are included in Appendix A.
Table 2: Sloped Roof Thermal Test Results
PV Panel Electrical Output
The electrical measurements and calculated module current outputs are presented in Table 3.
Table 3. PV module electrical measurements recorded during Sloped Roof collector testing.
|
|
5 |
|
DISCUSSION AND CONCLUSIONS
The prototype solar energy systems described in this test report provide three benefits:
- natural ventilation of the building interior space,
- thermal energy in the form of heated air,
- natural illumination into the building space, and
- electrical energy from integrated photovoltaic panels.
All four of these benefits have been verified and quantified, under defined test conditions, for the
prototypes described in this report. These benefits would be useful at different times of the year.
For example, the natural ventilation effect would be useful in the summer time, while the heated
air would be useful for space heating during the heating season if the air flowing through the
solar collector was recirculated back into the building.
Natural Ventilation Effect
Figure 1 in Appendix A shows that, under the natural convection conditions that this test was
conducted, the air temperatures below the solar roof are representative of what one might expect
for a standard open building. The air is relatively constant temperature (about 24 °C) at the
lower levels (16 inches to 48 inches from the floor), with the hot air (30 °C) confined to the
upper air layer just under the solar roof. This first test showed that the configuration of the
prototype was able to extract 7.8 ± 3.9 cfm from the model “building” that the prototype solar
roof was built on. Using a collector area of 12.75 ft², this represents a natural convection airflow
rate of 0.6 ± 0.3 cfm/ft². The relatively high uncertainty on this value is due to the very low free
convection flow velocity. A larger (full scale) solar roof would be expected to produce a
correspondingly larger air flow rate. As noted in previous sections of this report, only about 55%
of the collector aperture area was irradiated; the rest was shaded by parts of the roof closer to the
light source. In a full-size solar roof, the solar collectors may be spaced apart farther to reduce
the amount of shading, in which case the flow rate of air out of the building would be expected to
be greater than the 0.6 ± 0.3 cfm/ft² measured for this prototype.
Solar Air-Heating Effect
The maximum air temperature reached by the air exiting the Sawtooth prototype was 46 °C, and
the maximum air temperature exiting the Sloped prototype was 68 °C. These high temperatures
demonstrated the ability of the prototypes to produce the desired effect of heating air.
The efficiency was measured for each prototype at three different flow rates and two different
ambient temperatures. The thermal efficiency of the Sawtooth prototype was measured to be
between 12% and 37%. The thermal efficiency of the Sloped prototype was measured to be
between 8% and 32%. The thermal efficiency of both prototypes were seen to be dependent
upon air flow rate and outdoor ambient air temperature, as would be expected of any solar
thermal collector. The measured efficiencies of the prototype solar roofs—both the Sawtooth
and the Sloped—are lower than the thermal efficiencies of more conventional air-heating solar
collectors. Both the lack of insulation on the sides of the “collector plenums” on top of the solar
absorbers and the shading seen on the Sawtooth design (see Appendix B) would contribute to the
low efficiencies measured.
The limited number of test points were not sufficient to produce the standard type of solar
collector efficiency curves normally associated with solar collector testing (e.g. as described in
the solar collector rating method of SRCC OG-100). Moreover, the construction of the
prototypes made it difficult to separate the solar collector part from the simulated building part
(referred to as the box) of the prototypes. In particular, Bodycote’s test apparatus delivered the
inlet air into the side of the prototype rather than directly into the solar collector. That resulted in
a temperature difference between the air entering the prototype and the air entering the collector
proper, since the air experienced some temperature change due to heat losses or gains through
the side walls of the “box”. Air leakage from the prototypes was also identified during the
testing, and an attempt was made to minimize that leakage. In a real implementation of this
design, it should be possible to provide both better air seals and better insulation.
Daylighting Effect
The maximum air temperature reached by the air exiting the Sawtooth prototype was 46 °C, and
the maximum air temperature exiting the Sloped prototype was 68 °C. These high temperatures
demonstrated the ability of the prototypes to produce the desired effect of heating air.
Overhead daylighting from a north-facing clerestory, such as demonstrated in the Sawtooth
prototype, is a well-understood architectural feature. The prototype tested in the present work
was demonstrated to admit an illumination of 840 lux on a horizontal plane inside the model
“building” 16 inches below the bottom of the bottom of the sawtooth solar collectors during
midday clear sky conditions.
For comparison, the National Building Code of Canada requires that minimum lighting levels be
100 lux in recreation rooms and public washrooms, and 200 lux in laundry rooms and service
areas. As a general rule, light levels decrease with distance from the light source. In the case of
the prototype tested here, the light source is the clear glazed area of the clerestory windows built
into the solar collectors. Lighting levels at the floor level in a real building equipped with the
Sawtooth collector design will depend upon (as well as outdoor natural illumination levels) the
height of the roof, the area of the clerestory glazing compared to the floor area, and the geometry
and colour of the room being illuminated.
Electrical Energy Production
The electrical energy produced by the PV panels installed inside the sloped roof prototype is
summarized in Table 4. The temperatures measured on the back of the PV panels should be
close to the PV cell operating temperatures. These cell operating temperatures can be seen to be
very high at the low airflow rate of 0.6 cfm/ft2, and decrease with increasing airflow rate. The
solar irradiance during these tests was 89% of the solar irradiance used in rating PV panels. Both
the high cell temperatures and the lower test irradiance contribute to the observed low electrical
output of the test panel compared to its rated electrical output of 50 W.
Table 4: Summary of Electrical Energy Output
Reported by:
Larry E. West, C.E.T.
Solar & Weathering Test Facility |
Reviewed by:
Dr. Alfred P. Brunger, P. Eng. Manager Solar & Weathering Test Facility |
This report refers only to the particular samples, units, material, instrument, or other subject
used and referred to in it, and is limited by the tests and/or analyses performed. Similar articles
may not be of like quality, and other testing and/or analysis programs might be desirable and
might give different results.
APPENDIX A Temperature Graphs (13 Pages)
Figure 1. Air temperatures recorded during Maximum Airflow test on the Sawtooth collector.
Figure 2. Air temperatures recorded during first thermal efficiency test.
Figure 3. Air temperatures recorded during second thermal efficiency test.
Figure 4. Air temperatures recorded during third thermal efficiency test.
Figure 5. Air temperatures recorded during fourth thermal efficiency test.
Figure 6. Air temperatures recorded during fifth thermal efficiency test.
Figure 7. Air temperatures recorded during sixth thermal efficiency test.
Figure 8. Air temperatures recorded during first thermal efficiency test of Sloped Roof collector.
Figure 9. Air temperatures recorded during second and third thermal efficiency tests.
Figure 10. Air temperatures recorded during fourth thermal efficiency test.
Figure 11. Air temperatures recorded during fifth thermal efficiency test.
Figure 12. Air temperatures recorded during sixth thermal efficiency test.
APPENDIX B Digital Images of the Prototype Collectors (4 Pages)
Figure 1. Prototype System 1 – Sawtooth Roof (note shading due to close spacing of collectors)
Figure 2. Prototype System 1 – Sawtooth Roof
Figure 3. Prototype System 2 – Sloped Roof
|
Patrick O'Leary
(917) 945-8480
email: admin@futurasolar.com |